Tracking Live Betting Volume Shifts in International Tournaments Using Aggregated Data
Bianca Sullivan · Oct 21, 2026
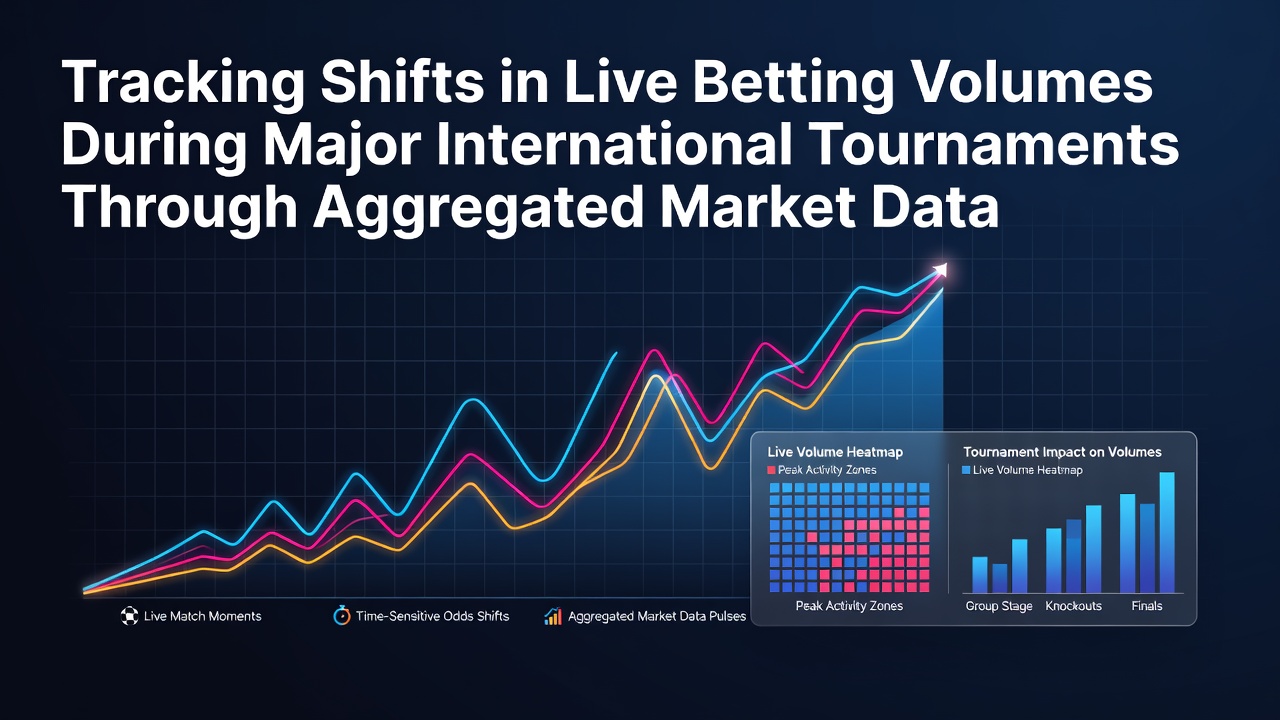
Tracking Live Betting Volume Shifts in International Tournaments Using Aggregated Data
Market analysts rely on aggregated data sets to monitor how live betting volumes move during major international tournaments, and these collections pull from multiple sportsbooks to create broader pictures of activity levels. Researchers combine transaction records, odds adjustments, and real-time stake amounts to identify when volumes spike or drop in response to game developments. This approach reveals patterns that single operators might miss when reviewing their own figures alone.
Core Components of Aggregated Market Data
Aggregated market data draws from licensed operators across regions and includes elements such as total stake amounts placed in specific markets, frequency of bets on live events, and shifts in odds that signal changing demand. Analysts apply statistical models to normalize these inputs so comparisons across tournaments remain consistent even when different sports or time zones are involved. Data providers update feeds continuously during matches, which allows observers to correlate volume changes with on-field incidents like goals, injuries, or weather interruptions.
During the 2026 FIFA World Cup cycle that extended into summer events, aggregated figures showed pronounced increases in live betting on secondary markets such as corner counts and player performance metrics once teams reached knockout stages. Similar tracking in cricket and rugby internationals has highlighted how penalty situations often trigger immediate volume surges that last several minutes before settling.
Observed Patterns Across Recent Events
Studies of aggregated records indicate that live betting volumes tend to rise sharply in the final 15 minutes of matches when scores remain close, whereas early tournament group stages produce steadier but lower overall activity. One analysis of European championship data found that aggregate stakes on over/under goals markets increased by more than 40 percent in extra time periods compared with regular play. Observers note that these movements appear across multiple sportsbooks simultaneously, which strengthens confidence that the shifts reflect genuine market behavior rather than isolated platform anomalies.
October 2026 brought additional data points from ongoing club competitions that overlapped with national team qualifiers, and aggregated feeds captured volume transfers between these overlapping calendars. When major football leagues paused for international breaks, live betting activity on national team friendlies showed distinct midday peaks in Asian time zones that differed from evening patterns typical of European domestic fixtures.

Methods for Detecting Volume Shifts
Analysts use time-series decomposition to separate baseline tournament volumes from short-term spikes tied to specific triggers. Machine learning classifiers trained on historical tournament data help flag anomalies where aggregate stakes exceed expected ranges by standard deviation thresholds. These tools operate on anonymized data pools that comply with regional privacy regulations, and outputs feed into dashboards used by operators and regulators alike.
Cross-referencing with public match statistics allows researchers to test whether volume movements align with measurable game events. For instance, data sets from recent rugby world cup cycles revealed that aggregate live betting on try-scoring markets responded within seconds of line breaks or scrum resets, confirming the responsiveness of the underlying feeds.
Regional Variations and Regulatory Context
European operators contribute heavily to aggregated pools, yet North American and Australian markets add distinct volume signatures during their respective tournament schedules. Reports from the European Gaming and Betting Association document how regulatory changes in individual member states have altered the granularity of data available for aggregation. Meanwhile, figures compiled by Canadian provincial regulators illustrate different live betting rhythms during international ice hockey events compared with football tournaments.
Academic teams at institutions such as the University of Sydney have examined aggregated data sets to quantify how time-of-day effects influence volume during multi-time-zone tournaments. Their published models show consistent evening peaks in betting activity on matches involving teams from high-population regions, independent of the sport contested.
Conclusion
Aggregated market data supplies a scalable framework for tracking live betting volume movements throughout international tournaments, and continued refinement of collection methods supports more precise correlations between game events and market responses. As additional operators join shared data initiatives, the resolution of these insights continues to improve while maintaining compliance with applicable oversight frameworks.